Few American metropolitan areas experienced the explosive growth, both demographic and economic, of Atlanta in the post–World War II period. But the 2007 financial meltdown and Great Recession hammered Atlanta, and the metro area has yet to recover fully.
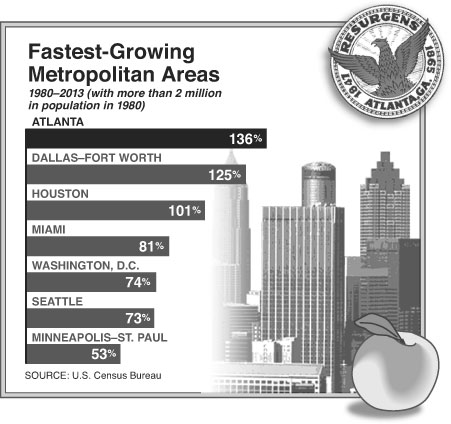
The first post–World War II census (in 1950) showed Atlanta to be the 23rd-largest metro area in the United States (as metropolitan areas were then defined), with a population of 670,000, slightly ahead of nearby Birmingham but somewhat smaller than Seattle. By 2010, Atlanta’s population had climbed to 5.3 million, making it the nation’s ninth-largest city—leaving Birmingham in the dust and vaulting ahead of Seattle by nearly 2 million people. Atlanta’s population expanded 136 percent between 1980 and 2013, outpacing the three next fastest-growing major metropolitan areas in the U.S., all in the South: Dallas–Fort Worth, Houston, and Miami. Indeed, over that period, Atlanta has been the fastest-growing city with a population of more than 5 million in the high-income world. Only Singapore and Toronto have rivaled it in rate of expansion.
Yet after the Wall Street crash, Atlanta’s robust rate of population growth sputtered. It contracted to 0.9 percent yearly between 2007 and 2010, before picking up again from 2010 through 2013, though at an annual rate of 1.4 percent—well short of its expansion pace over the past three decades.
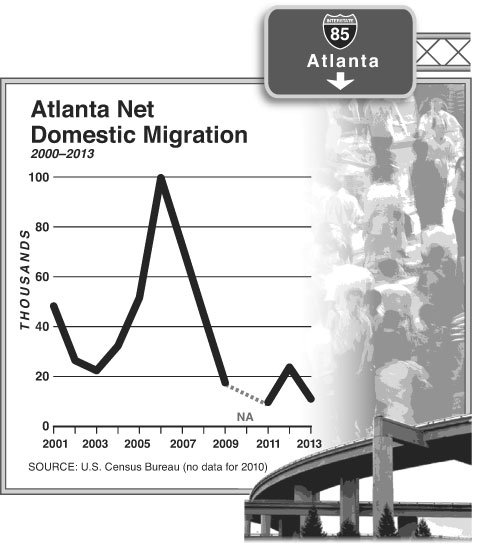
Domestic migration—people moving from other parts of the United States—fueled Atlanta’s long population boom, and a falloff in that category is to blame for the metro’s weak growth, post–financial meltdown. During the 2000s, Atlanta’s domestic migration was a roller coaster. Between 2000 and 2001, the metropolitan area added nearly 50,000 net domestic migrants, a number that fell substantially over the next two years, after the dotcom bubble burst. Domestic migration then rocketed upward, hitting a high of a net 100,000 in 2006, before cratering with the financial meltdown.
Most of the domestic migration to Atlanta has come from just a few states, with Florida sending the most newcomers (by the precrisis mid-2000s, more than 27,000 net migrants annually), followed by New York and—perhaps surprisingly, given its distance—California. Atlanta’s falloff in net domestic migration coincided with the meltdown’s associated housing bust, which was particularly grim in Florida, a state that had one of the nation’s biggest housing bubbles. A lot of the Floridians moving to Atlanta fell into the category of “halfback” migration—people who’d moved from the Northeast to Florida but then cashed out their higher-cost homes during the bubble and moved “halfway” back to more affordable places like Georgia, Tennessee, and the Carolinas. That movement virtually stopped, postcrisis.
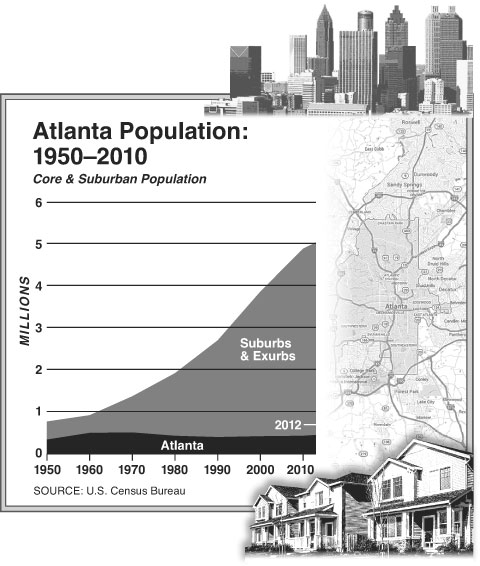
As has been true of almost all major U.S. metropolitan areas, Atlanta’s suburban population growth has far outpaced core city expansion since the end of World War II. The city of Atlanta proper has added fewer than 90,000 new residents between 1950 and 2010, despite expanding its land area by 2.5 times. Meantime, suburban Atlanta has swollen by 4 million over that period. The city of Atlanta now has only 8 percent of the metro’s population, one of the lowest such core figures in the nation. Keep this in mind anytime someone contends that the mayor of Atlanta speaks for the entire metro area.
Atlanta’s employment scaled to an all-time peak in 2007, just before the downturn, and then plummeted 8.4 percent between 2007 and 2010, putting the city a dismal 42nd in employment performance during that period among the nation’s 52 metros with more than 1 million in population. Bank failures triggered by the crisis were more extensive in Georgia than in any other state.
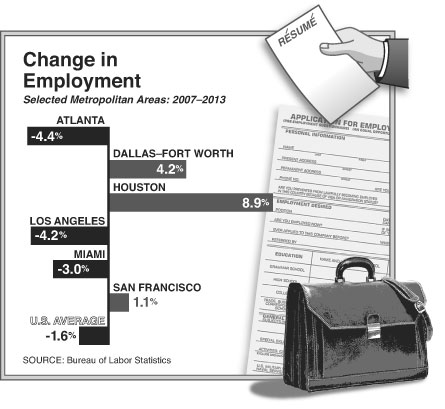
Employment in the Atlanta metro area has started moving up again, though it still remained more than 4 percent below its 2007 high as of late 2013 (the last year for which Bureau of Labor Statistics numbers are available). That compares poorly with some of the city’s southern competitors, including Houston, which has added almost 9 percent more workers since 2007, and Dallas–Fort Worth, which is up more than 4 percent over its 2007 total.
And the numbers may mask a starker economic decline in the Atlanta area. Since 2000, per-capita employment in the Atlanta metro has shriveled from 51.2 percent to 40.6 percent. That’s the worst performance among America’s major metropolitan areas.
Can Atlanta regain its lost mojo? The metro has significant competitive advantages, but it also faces real challenges.
There’s some good prospective news on the economic front. In 2013, Site Selection magazine named Georgia as having the top business climate in the nation, according to professional business-site selectors. Georgia also gets a good business-climate ranking—tenth in 2014—from Chief Executive. And Georgia’s depressed jobs-to-resident ratio suggests considerable potential for boosting the size of the state’s workforce at competitive labor rates. Georgia is also a “right to work” state, which typically means lower costs to run businesses. The Tax Foundation puts Georgia 14th in the nation in its tax burden relative to incomes—though nearby states South Carolina, Tennessee, Alabama, and Mississippi all rank friendlier on this score. As for Atlanta itself, KPMG ranks it as the Number One most competitive metropolitan area for business in the nation.
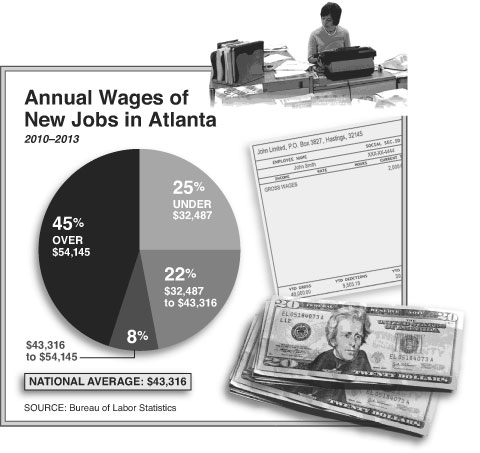
Moreover, a large share of the new positions created since 2010 pay wages above the national average. Approximately 45 percent of the new jobs are in industries with average hourly earnings 25 percent or more above the U.S. average ($43,316)—many in the category of business services. Another 8 percent of jobs are in industries that pay somewhere between the U.S. average and 25 percent above it. Roughly a quarter of Atlanta’s new jobs pay less than 75 percent of the U.S. average.
And the city has an additional advantage: it’s one of the country’s most affordable metros for housing. Housing affordability is a key driver of domestic migration. Between 2000 and 2013, a net 3.38 million residents moved away from the most unaffordable major metropolitan areas—those with median multiples (the ratio of an area’s median house price to its median annual household income) of 4.5 or above. During the same period, 1.63 million residents moved to metros with median multiples of less than 4.4. Atlanta has been an affordable housing market for decades, never exceeding a median multiple of 3.0 until the housing bubble and, even then, climbing only to 3.1. Atlanta’s median multiple is now 2.9. The affordability is typical of metro areas, like Atlanta, that haven’t imposed urban-containment (i.e., anti-sprawl) policies.
Unfortunately, local planners, especially the Atlanta Regional Commission, threaten to overturn this regional advantage. They have been pushing for new policies of urban containment and “smart growth” (concentrating growth in dense urban neighborhoods), which are associated with higher median multiples in California, Florida, the Pacific Northwest, and elsewhere, and would likely make housing much more expensive in the currently not-so-dense Atlanta region.
Another potential obstacle to Atlanta’s full economic and demographic recovery is its reputation for heavy traffic. Transportation is an important consideration when firms make decisions about expansion and relocation, since congestion creates problems both for workers trying to get to the office and for the movement of goods. A shibboleth of urban planning is that lower-density suburban development generates greater traffic congestion; the opposite is true. Despite its reputation, sprawling Atlanta is actually less road-clogged than many U.S. cities— it ranked 14th worst out of 51 U.S. metros, according to Tom Tom, the international auto-navigation system firm. Denser cities such as Los Angeles, Chicago, and Portland (the darling of urban planners) all suffer from worse traffic woes. But Atlanta’s average work-trip travel time of 29 minutes is nevertheless a major frustration; commuters in all of Atlanta’s southern metro competitors have quicker trips to and from work.
What might speed up commute times? Not more mass transit, though local planners seem endlessly enamored of boutique urban transit projects, such as the recently launched downtown Atlanta streetcar. In fact, Atlanta has built the nation’s third-largest post–World War II metro (subway and elevated) system, the first link of which opened in 1979; the six-route MARTA system now extends 48 miles. But even with this massive capital improvement, the share of travel by public transit in the Atlanta metro has fallen precipitously, from 7.9 percent in 1980 to 2.9 percent today. Anticipating that additional transit projects will replace demand for auto travel in the Atlanta metro is no more plausible than expecting more cars to take demand away from Manhattan’s subway system. Far more promising is the Georgia Department of Transportation’s push to implement high-occupancy toll lanes in the Atlanta area, which should improve the flow of the 99 percent of local travel that goes by automobile. “Getting the traffic moving” will be crucial in maintaining and improving Atlanta’s competitiveness.


