Notoriously, New York City's budget gives its taxpayers just about the worst deal in urban America. Not only do they pay startlingly high levies to fund it, but they also receive skimpy benefits from it in terms of the services that make urban life comfortable and convenient. Less visibly, the swollen budget, tumor-like, saps the city's economic health, depressing job growth, driving businesses away, and preventing the city from enjoying the expansive prosperity that buoys up much of the rest of the nation. The more money New York taxpayers spend, the less of a future do they seem to buy.
In outline, this tale is familiar enough, no doubt, if little regarded. Our goal here is to document and quantify these facts in dramatically concrete detail. Perhaps if New Yorkers can see graphically just how grotesquely out of whack municipal spending has come to be, how little of value it buys, and how catastrophic is the harm it inflicts on the city, they will summon the political resolve to change it. Doing nothing isn't a viable option: as our data suggest, this state of affairs can't endure forever. New jobs, proliferating in the other major U.S. urban centers, are not springing up in New York, which bodes ill for the city's long-term ability to sustain its bloated public sector.
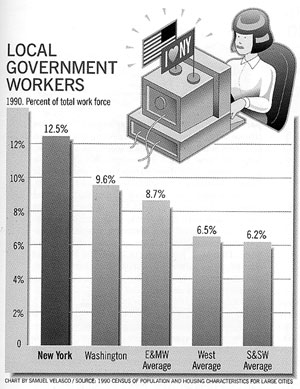
New York's public sector is vastly larger than the public sector anywhere else. It employs a higher share of the workforce than in any other big U.S. city. Fully one in eight employed New Yorkers works for the local government, and an additional 3.4 percent of the city's labor force is in the social services sector, primarily funded by the city, bringing the total up to over 15 percent. By contrast, city workers account for only 8.7 percent of the average eastern big city's workforce and only 9.6 percent even ofpatronage-ridden Washington's. To pay the wages and unusually generous benefits of this vast army, and to cover the checks that so many public servants hand out to vendors and clients of every description, the residents of New York pay stupendous taxes. In their most whimsical moments, Gothamites take a perverse pride in being the most heavily taxed urban population outside Washington, D.C. How gargantuan is New York's public sector? To find out, we compared the budgets of 18 of the largest U.S. cities (those with populations exceeding 500,000, in counties with populations exceeding 1 million) with the New York City budget. We also broke our comparison down into three geographic areas: eastern and midwestern cities (E&MW), southern and southwestern cities (S&SW), and cities of the West. The E&MW cities are most comparable with New York, with similar demographics and economic histories, shaped by similar changes in technology and industrial structure. The newer and quite different West and S&SW cities offer an instructive comparison, too, for they present a powerful source of competition for jobs and residents.
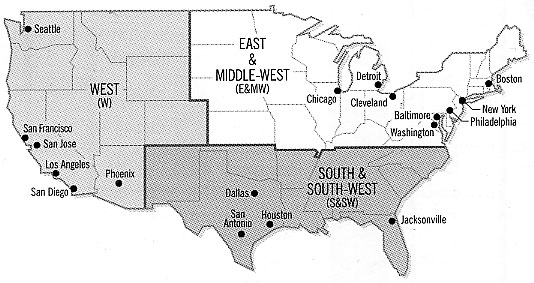
Finding comparable numbers on these matters is not easy or straightforward, and we have scrupulously tried to compare like with like. For those who take an interest in such things, this paragraph explains what we did. Because New York combines functions of both city and county government, you can't just compare New York's spending on hospitals with Chicago's, say, or Los Angeles's, because Cook County and L.A. County pay for that item, not the cities themselves. Therefore, we combine the per-capita levels of city and county governments for our 18 comparison examples (since in those areas the county per-capita expenses apply largely to the city). We also use county numbers for employment (since that is how they are available) and population (so that we can calculate meaningful employment-to-population ratios). The seven E&MW comparison cities are Baltimore, Boston, Chicago, Cleveland, Detroit, Indianapolis, and Philadelphia. For the West, the cities are Phoenix, Seattle, San Diego, Los Angeles, San Jose, and San Francisco. The S&SW cities are Jacksonville, San Antonio, Dallas, and Houston. We also include, in a category all its own, Washington, D.C. Our regional averages are simple averages across cities, rather than population-weighted averages. The fiscal data we examine are from 1994, the demographic data from the population census conducted in 1990—the latest comparable numbers available. (Detailed city-by-city tables in Microsoft Excel format may be requested by contacting questions@city-journal.org.)
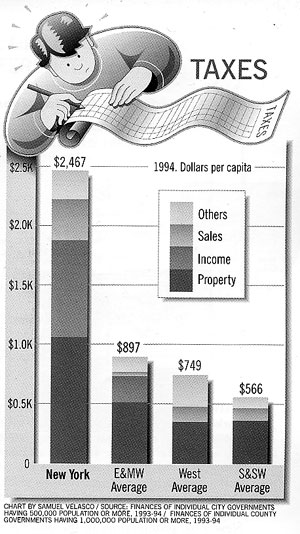
First look at New Yorkers' comparative tax burden. Gothamites paid $2,467 per person in city taxes during 1994—which means that for every $8 in income, they shipped almost $1 off to City Hall. Only Washington, D.C., burdens its residents more, with crushing taxes of $4,405 per capita. San Franciscans shoulder the next-highest tax burden after New Yorkers, but the $1,286 they pay is barely one-half the New York level. As the chart on page 43 shows, the tax level in New York is 2.75 times the average level of the E&MW comparison group, 3.3 times the level in the West, and a mind-boggling 4.36 times the level of the rising cities in the S&SW.
Of course, local taxes constitute only about 40.6 percent of New York City's total revenue, while grants from the state and federal government account for another 35.2 percent of it, and charges and other sources make up the remainder. When you add it all together, New York's total budget amounts to $6,682 per capita—2.4 times the E&MW, 2.1 times the West, and 2.97 times the S&SW.
One signal that the level of taxation is too high in New York is the extent to which the city strip-mines virtually every known revenue source. Only six cities out of 18 have city income taxes, and three of these half-dozen do not have sales taxes. Thus, the only four cities using all major sources of tax revenue are Washington, D.C. (the highest tax burden), New York (the second highest), Philadelphia (fifth), and Cleveland (sixth)—not a very prepossessing comparison group for the financial capital of the world. Three of these cities have been on the brink of bankruptcy sometime during the past 25 years, including New York; the fourth, Washington, D.C., isn't currently fit to govern itself, according to Congress. (See "How the G.O.P. Can Make D.C. OK" on page 59.)
The trend over time is not all that encouraging, either. Excluding education, since 1986 the city's expenditure has grown at a 2.3 percent annual rate in real terms (even faster when education is included), on top of the 3.85 percent annual growth due to inflation. Thus, not only is the public sector large, it is taking an ever-larger share of the income of New York taxpayers.
In an Autumn 1991 City Journal article ("Where the Money Goes"), one of us, Steven Craig, first detailed the disproportionate size of New York's budget and pointed out a further disturbing anomaly in New York's spending compared with that of other big cities. As the article showed, much of the city's spending didn't go to the basic services that most city residents use. Instead, vast sums flowed out to a multitude of activities most other cities don't perform. Consequently, the ordinary New Yorker faced a considerable fiscal deficit, meaning that the services government returned to him were worth far less than the tax cost to him. The fiscal deficit facing the average New York taxpayer, we find, remains dismayingly large in 1994—and in 1996 as well, though, as we'll show below, matters improved a bit in the intervening two years.
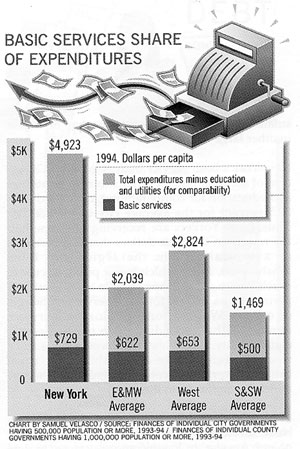
By the basic service budget, we mean expenditures on the core services cities traditionally provide, including police, fire, corrections, transportation, parks, and education (we have excluded utilities because, though New York City provides water to its residents, it provides neither gas nor electricity, as some other cities do). To compare New York with other big cities, we have had to subtract education, since in most localities, unlike New York, it is provided neither by the city nor the county government but by separate school districts. New York's expenditures on these basic services are $729 per person ($1,784 including education). This is 17 percent higher than the E&MW average of $622 and comparably higher than the other regional averages in our sample.
But spending on basic services is nowhere near the stratospheric heights of the overall budget—17 percent higher is a far cry from the 110 percent to 197 percent by which the total New York budget exceeds the total average budgets of the comparison cities. Since basic spending is so much smaller a share of the budget in New York than elsewhere, the average resident is getting a much smaller return for his tax payment than he would in other large cities.
New York's basic service budget is only 14.8 percent of the total budget (after subtracting utilities and education for comparability), compared with 30.5 percent for the average city in the E&MW. Thus, New Yorkers are receiving only one-half the return on their tax dollars than the residents of a typical city in the region do. Even Washington, D.C., which has a public sector in much worse fiscal shape, is able to eke out 20.1 percent of its budget for basic services—though, of course, Washington's deplorable services remind us that expenditures do not necessarily equal quality. Still, New York would have to be twice as efficient as the average big city to equal the basic service level provided elsewhere—which is very far from the case.
If New York spends so little of its city budget on basic services, where is the bulk of the money going? Answer: to low-income assistance, to debt service, and to a host of activities that are not the usual province of city governments.
New York spends more than ten times as much per capita as the average E&MW city—and 58.5 times as much as the S&SW average—on low-income assistance, which comprises social services, hospitals and health, and housing. The difference between New York and cities in the West is less dramatic—because, like New York, California cities have significant local responsibility for welfare—but it is still more than 100 percent larger. New York's hospital spending is an astronomical $488 per capita, 312 percent more than cities in the E&MW, 214 percent more than the West, and 404 percent more than the S&SW. Similarly, public housing expenditures in New York amount to $349 per capita—over 350 percent of the level of spending in any other region in the country.
True, high levels of state and federal aid partially fund many of these low-income assistance programs. The total cost of these programs is $1,959 per capita, but state and federal aid lighten the net burden to New York's taxpayers to "only" $918 per person. Other cities benefit from these aid programs, too, of course. Subtracting out state and federal aid, the city faces an enormous net burden relative to other cities: the local taxpayer must pay 358 percent more for-income assistance than taxpayers in other E&MW cities, almost double what those in the West pay, and six times the level of those in the S&SW. And since the city is not getting back from Albany any more than Gothamites are paying in state taxes, in a very real sense state aid dollars are coming entirely out of city taxpayers' pockets, too.
New York spends a similarly disproportionate $494 per capita on "expenditures not elsewhere classified," a grab bag of goods and services completely outside the expenditure pattern for typical local governments—everything from crime-victim compensation to services to senior citizens who are not poor. The typical city in the E&MW spends only $180 per capita on this category, or just over one-third the amount spent in New York. Other cities spend even less: $112 in the West and a thrifty $73 in the S&SW.
Our comparative fiscal data come from fiscal year 1994, the last under Mayor David Dinkins's budgetary control. How have things changed with Mayor Giuliani in City Hall? Though we don't have the data to compare New York with other cities during the Giuliani administration, we can compare New York's 1996 tax and expenditure patterns with those of 1994. The following discussion, however, pertains only to the city's "on budget" expenditures, amounting to about three-quarters of the total. New York accounts for many big-ticket agencies, including housing and hospitals, elsewhere.
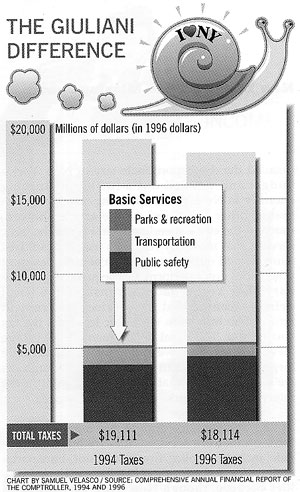
Overall, the picture is slightly improved. In nominal dollars, total taxes in New York were about constant in 1996 compared with 1994, indicating a drop in real terms (that is, after accounting for inflation) of some 5.2 percent—a modest amount but still a change in the right direction at least. Again in real terms, total revenue to the city fell slightly less, by 3 percent, because increases in state and federal aid offset the tax reductions.
But as the chart on page 45 shows, if total taxes haven't dropped much, the profile of what those dollars buy the taxpayer has improved. Spending on basic services has increased, mainly because police spending went up by 26.5 percent. With the murder rate down by over 60 percent and New Yorkers feeling that their city has a new lease on life as a result, at least some of these dollars appear to have provided a return to taxpayers. Fire department expenditures rose 8.3 percent, perhaps accounting in part for the fall in fire-related deaths to their lowest point in 37 years in 1996.
Social services expenditures fell by 1.6 percent in 1996 from 1994, or 6.7 percent in real terms. But by the end of the 1996 fiscal year on June 30, New York's highly successful welfare reforms had only recently really gotten under way: between March 1995 and June 1997 the city cut 280,000 recipients from its welfare rolls, representing meaningful future savings.
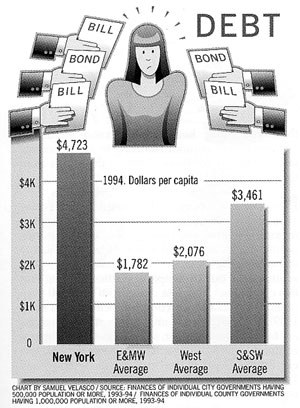
Worryingly, debt service expenditures grew 4.9 percent from 1994. Our comparison data show New York taking on debt as if it were building its infrastructure anew—which it clearly is not. Incredibly, New York has per-capita debt service expenditures 14 percent higher than the young and rapidly expanding cities of the S&SW, which you'd expect to have high debt and debt service levels, even though Gotham's population has not yet returned to its 1980 (or even its 1940) level. Compared with older cities, New York spent 2.3 times what the typical E&MW city paid for debt service per capita in 1994. Given the maturity of New York's economy and of its infrastructure, the $4,723 per capita of net general debt that weighs down New York taxpayers is tough to justify.
In a similar vein, pension contributions by the city ballooned 6.5 percent in 1996 from a 1994 base that was already over twice the level of the average E&MW city. Fattened pensions are one method the city has long used to shower more money on city employees without resorting to an immediate tax hike to pay for them. Some of these bills from the past are coming due.
New York, it is often said, is unique: so it's natural to ask whether, in comparison with the other major U.S. cities, its demographic and economic characteristics are special in ways that might justify its huge public sector and out-of-kilter budget. We again look at our 18 comparison cities, although for this comparison the data come from the 1990 population census (which contains income data from 1989). Relative income and demographic changes are fairly slow, however, so we believe the relative comparison is valid despite movements in the levels. Even though several comparisons show New York as unusual, the short answer is no, New York isn't different enough from other cities to require its unique spending level.
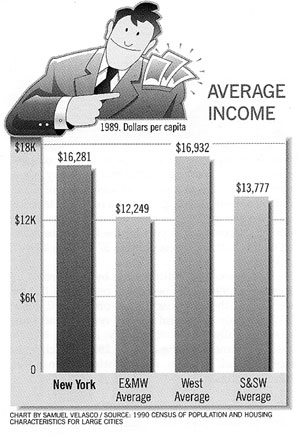
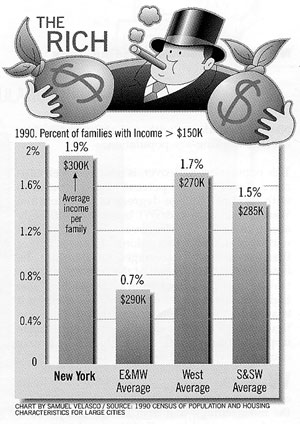
New York is a rich city, with per-capita income of $16,291, fully 33 percent greater than the E&MW average. Nonetheless, the average income level is not quite as high as in the typical city in the West. Further, if we took out the West's last-ranked Phoenix, New York's per-capita income would be only 93 percent of income in the West. Yet at the very upper end of the income distribution, New York sparkles; no city has a higher combination of share and level of wealth. For example, 1.88 percent of Gotham's families have income greater than $150,000, considerably above the E&MW rate of only 0.67 percent and even above the 1.72 percent rate in the millionaire-studded West. The rich in New York are richer as well, since the average income of the 1.88 percent of families with incomes above $150,000 is $300,048. This is greater than all the western cities and lags only Baltimore (with $315,000) and Cleveland (with $312,000), which have far fewer such families (0.77 percent and 0.15 percent, respectively).
To be sure, because the city is well endowed on the upper end, it can arguably afford a larger public sector than elsewhere. Slightly larger. If taxes were proportional to income, New York's taxes could be as much as 33 percent higher than the typical E&MW city. If the taxes were sufficiently progressive, the disparity could even be a little greater. Taxes 175 percent above average, however, are off the charts.
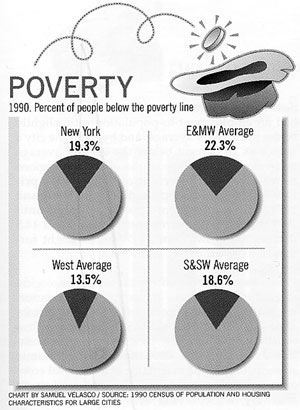
At the other extreme, while New York's poverty rate of 19.3 percent looks like a big number, it is lower than the 21.7 percent poverty rate in the other E&MW cities. Females head 8.5 percent of New York households, a whisker above the E&MW average of 8.4 percent. The poverty problem, in other words, is a national problem, not one localized in New York and thus requiring runaway welfare spending.
Demographically, the city's peculiarities are only at the margins—overwhelmingly, New York's demographics resemble, rather than differ from, those of other cities. The population of the five boroughs is 52.3 percent white, quite close to the 54.0 percent E&MW average. True, nonwhite New Yorkers are more various than elsewhere: blacks constitute only 28.8 percent of the city's total population, compared with 40.2 percent in the other E&MW cities, and New York's Hispanic population (both black and white) constitutes 23.7 percent, way above the E&MW cities and comparable with many California cities (though below Texas's numbers). And even more unusual, 28.4 percent of New Yorkers are foreign-born. Only Los Angeles and San Francisco have a higher share, and only two E&MW cities (Boston and Chicago) have even more than ten percent. Similarly, New York has a disproportionate share of adults who do not speak English (10.6 percent) or are noncitizens (14.4 percent).
So, too, with New York's age distribution: despite its quirks, in the most important respect it is remarkably similar to other places. To be sure, it has fewer kids than most places: only 25.7 percent of its population is under 20 years old, compared with 28.4 percent for the average E&MW city. In addition, over 20 percent of those kids attend private school, compared with 18.6 percent for the average E&MW city (and much lower for the West and S&SW). But this relatively small young population is partially offset by a relatively large elderly population (65 and over), 13.0 percent of New Yorkers, compared with the 12.2 percent E&MW average. The net result—and this is the key point—is that New York ends up with a slightly larger than average working-age population.
This population, moreover, is relatively well educated. True, the 12.9 percent of the population with terminal college degrees is far below the West (and even the S&SW), but it is significantly above the E&MW. Moreover, the 10.0 percent with a graduate or professional degree is higher than all the regional averages. On the flip side, however, the 31.7 percent of the adult population that has not graduated from high school is also high, except compared with the E&MW, where it is average. Thus, as with the income-distribution figures, New York is slightly larger at both the upper and lower tail, although not by nearly enough to explain its bloated public sector.
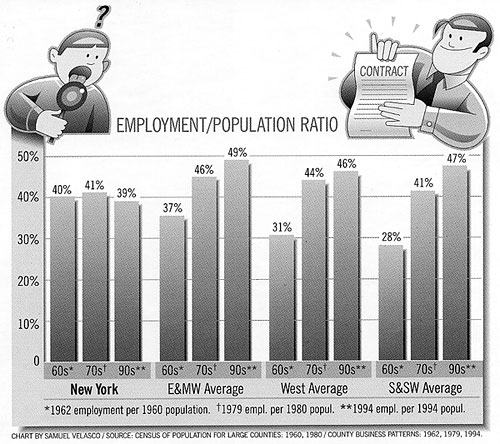
What is the consequence for New York of its out-of-kilter taxation and public spending? To us, the most telling—and disturbing—comparative number is something called the employment-to-population ratio, which measures the relationship between the number of jobs in a given city (which may be held by commuters as well as by locals) and the number of residents (who may work elsewhere than in the city). The employment-to-population ratio is an excellent indicator of economic health, especially for a city that has distorted its housing market through extensive rent regulation and consequently has kept its population artificially low. A city that is thriving as the economic center of its region has a high concentration of employers, a high number of commuters flocking in to their jobs, and consequently a high employment-to-population ratio. Back in the 1960s, or the fifties or the forties, New York had an employment-to-population ratio higher than that of any U.S. city except Boston and San Francisco—some 20 percent higher than the average E&MW city in 1962. But this specialness had evaporated by 1979, when New York had an employment-to-population ratio slightly below the E&MW average, and by 1994, the city's ratio was 20 percent below the E&MW average and below the average of the other two regions as well. While 6.9 percent of New York's private-sector jobs disappeared between 1962 and 1979, and employment kept on slipping until 1994, the E&MW metropolitan areas saw a 14.5 percent job growth until 1979 and a slight further rise since then.
What accounts for the difference? Vast technological and industrial changes—the decline of manufacturing, the revolutions in communications and distribution—swept over all old U.S. cities more or less equally. So why did New York suffer so great a relative decline in this key measure of economic strength, despite the magnitude of its regional economy, its ample access to suppliers and markets, its relatively well-educated labor force? Why didn't new industries grow up to take the place of the old in New York, as happened elsewhere in the E&MW?
Our data strongly suggest that the city's strikingly disproportionate level of taxation and its deep fiscal deficit are to blame. The numbers don't prove it conclusively, of course. But it is easy to see how such a cause might well produce such an effect. If business taxes (and the costs of complying with business regulation) exceed the economic benefit of being located in the city, businesses will decamp in search of higher profits elsewhere. In addition, high city taxes mean that employees will demand higher wages—even suburb-dwelling employees subject to the city's commuter tax. And that will drive firms to lower-wage areas.
The cost to the city of this ongoing economic erosion is enormous. If New York's employment-to-population ratio had remained equal to the current E&MW average—that is, if it had the average number of jobs given its residential population—its employment base would be 745,000 jobs larger. If it had remained the employment center it was in 1962, its employment base would be over 1 million jobs larger. At that employment level, if city taxes were 25.7 percent lower than today, the total tax revenue to the city would be the same as now.
This is a familiar conundrum: a rise in tax rates can in the long term produce a shrinkage of revenues. And as the employment tax base erodes, it starts a downward spiral from which it is very hard to escape. The residential tax base is likely in time to follow jobs out of the city. And just a few strategic taxpayers leaving can make a huge difference, since 5.5 percent of the taxpayers pay 47.6 percent of New York's personal income tax. As people and jobs leave the city, property values and tax receipts fall, as do income and sales tax receipts. And if the total tax burden remains the same, the per-capita burden grows even more insupportable.
Taxes and regulation, perennially cited as causes of urban decline, are problems that local government can affect relatively quickly, if not easily. Why not start by getting rid of either the city's sales tax or its income tax? The Giuliani administration could expand its move to exempt clothing from sales taxation to all the other sectors, or it could extend its move to repeal one of the income surtaxes to the entire tax. Sure, tax revenue would drop. But there's plenty of room in the bloated city budget to make corresponding spending cuts. General sales taxes, for example, raise $341 per capita. If the city cut $341 per capita (in 1994) from the unfocused "other" spending, the remainder would still be about average for E&MW cities (and above average compared with the remaining areas). Ending city income taxes would cut a heftier $828 per person out of the budget; but if New York reduced direct general expenses by $828 per person, it would still be spending over twice per capita what the average comparison city in the E&MW spends. Dropping one of the city taxes would start to make New York's fiscal situation a little less distinctive—just what it needs to give residents and employers something to smile about. And if it spent more of the remaining $5,854 per capita on the core service budget and less on pensions, low-income assistance, and its grab bag of nonessential government functions, New York might even start winning back some of those 1 million missing jobs.


